Most U.S. short-term rental markets have a season. Miami has a calendar.
The distinction is structural, not seasonal. In a market with a season, occupancy concentrates in three or four months and revenue compresses with it. The off-months underperform. Pricing has to amortize annual operating costs against a narrow window of strong demand.
Miami does not run that way. The combination of year-round international travel, a major-event calendar that compresses every quarter, the financial-corridor migration that began in 2020, and the submarket diversity that distributes demand across the urban core and the beachfront produces something rare: a 365-day demand engine that does not have a structural off-season.
For owners, operators, and the short-term rental management discussion, this changes the math.
Why Miami doesn’t have a slow season
The shorthand “off-season” describes a structural feature most U.S. markets share. Demand drops because weather is bad, the local population travels elsewhere, the school calendar suppresses leisure travel, or the regional economy slows. Miami’s geography and demand mix make this pattern not apply.
Winter is the city’s strongest leisure window because the rest of North America is cold. Spring is the strongest event window. Summer pulls Latin American family travel during the Southern Hemisphere school break. Fall begins the convention and snowbird cycle that runs through to December. The calendar does not have a hole in it.
Operationally, this means a Miami property’s pricing model is not “high season versus low season.” It is twelve months of distinct demand profiles, each with its own rate curve, length-of-stay expectation, and guest mix. Operators who run the city as a single seasonal asset miss the calendar’s actual shape.
Our Miami short-term rental management framework treats every month as its own pricing window, with event-driven adjustments layered on top of the underlying month-by-month curves.
The international demand engine
Miami is the U.S. city with the deepest non-domestic guest base. The mix is not abstract. It runs through specific source markets, specific submarkets, and specific operating implications.
Latin America. Brazilian and Argentine travelers anchor a significant share of Miami short-term rental demand, particularly in Brickell, Sunny Isles, and South Beach. Colombian, Mexican, and increasingly Peruvian and Chilean travelers add to the mix. The pattern is durable across economic cycles — when one Latin American country tightens currency outflow rules, others tend to compensate. The aggregate flow into Miami has been a persistent feature of the market for two decades.
Europe. The European share of Miami demand sits below the Latin American share but runs at meaningful volume — Spain, Italy, France, Germany, the U.K. European travelers tend to book longer stays (often 7–14 nights), making them strong revenue contributors per booking despite the smaller share of total volume.
Russian-speaking and Eastern European demand. Concentrated in Sunny Isles Beach, this segment has been a defining demographic for that submarket for two decades. Operating implications are linguistic (Russian-language listing copy and communication) and cultural (specific guest-experience expectations).
Northeast U.S. snowbird flow. Not international, but functionally similar in operational profile — multi-week stays, advance booking, repeat guests. Runs October through April, with peak weight December through March.
The four flows together mean that a Miami property is rarely competing only with other Miami properties for a single domestic guest pool. It is competing across multiple source markets with different booking behaviors, language requirements, and stay-length norms.
The event calendar
Miami’s event density distinguishes it from every other U.S. STR market except possibly New York and Las Vegas. The compression cycles distribute across all four quarters rather than concentrating in one.
December: Art Basel Miami Beach. The first week of December produces the strongest single compression event of the year for many submarkets. Hotel inventory sells out months in advance. Short-term rental properties — particularly in South Beach, Brickell, and Edgewater — see nightly rates 2–3x baseline during the peak nights. The economic impact is documented; the operational implication is that an operator who has not started Art Basel pricing in October has missed the booking window.
February: Miami International Boat Show. Five days in mid-February. Draws international yacht buyers, brokers, and the broader marine industry. Concentrated demand in Coconut Grove, Brickell, and Key Biscayne but with city-wide compression.
March: Miami Open + Ultra Music Festival. The Miami Open tennis tournament runs roughly two weeks at Hard Rock Stadium. Ultra Music Festival runs a weekend at Bayfront Park. The two together compress most of March, with Ultra producing the higher-rate spike concentrated on its three nights.
May: Formula 1 Miami Grand Prix. Since 2022, the F1 Grand Prix has become one of the largest single-event compression cycles in the city’s calendar. Three days of racing produce four-to-five days of compression. Demand pulls toward Hard Rock Stadium proximity but compresses citywide.
Continuous overlay events. Beyond the headline calendar, the Miami Beach Convention Center hosts a near-continuous flow of conventions, trade shows, and fashion weeks. Eden Roc, Loews, and Fontainebleau host major corporate events. The Faena Forum, Pérez Art Museum, and Frost Science Museum host gallery openings, cultural events, and private gatherings throughout the year. Each of these adds layers to the demand calendar that an operator’s pricing model needs to reflect.
The implication for owners is that Miami pricing is not seasonal. It is event-cadenced, and the operator’s ability to anticipate and price into each compression cycle is a meaningful share of annual revenue.
The financial-corridor migration
Beginning in 2020 and continuing through 2026, a sustained migration of financial-services firms into Brickell has changed the demand mix in a structural way.
Citadel’s relocation of its headquarters from Chicago was the most visible single event, but it was one of dozens. Hedge funds, family offices, private equity, fintech, and the broader services economy supporting them — law firms, consulting, accounting, executive recruiting — have continued to expand Miami presence. The downstream effects on short-term rental are operationally specific.
Corporate-stay demand has expanded. Executives in town for board meetings, recruiters interviewing candidates, transferees in the 30-to-90-day window between arrival and a permanent housing decision, and visiting partners on extended assignments all generate stay demand at higher nightly rates and longer average stays than typical leisure travel. Brickell properties capture this segment most directly, but the spillover into Edgewater, Coconut Grove, and the broader urban core is documented.
Midweek occupancy has strengthened. Beach-side submarkets historically run weekend-weighted occupancy with softer Tuesday-through-Thursday performance. The corporate-corridor migration has compressed midweek occupancy in Brickell specifically, with longer-stay corporate bookings filling weekday windows that previously underperformed.
Furnishing and amenity expectations have shifted. Properties that capture corporate-stay demand reflect specific operational requirements — work-from-home capable spaces, responsive Wi-Fi, dedicated workspace, predictable check-in. The standard differs from leisure-only inventory.
The migration has not reversed. The demand pattern it produced is now part of the market’s structure.
Submarket diversity that compounds demand
Miami is not one short-term rental market. It is at least five, each with its own demand profile, guest mix, and operational implications.
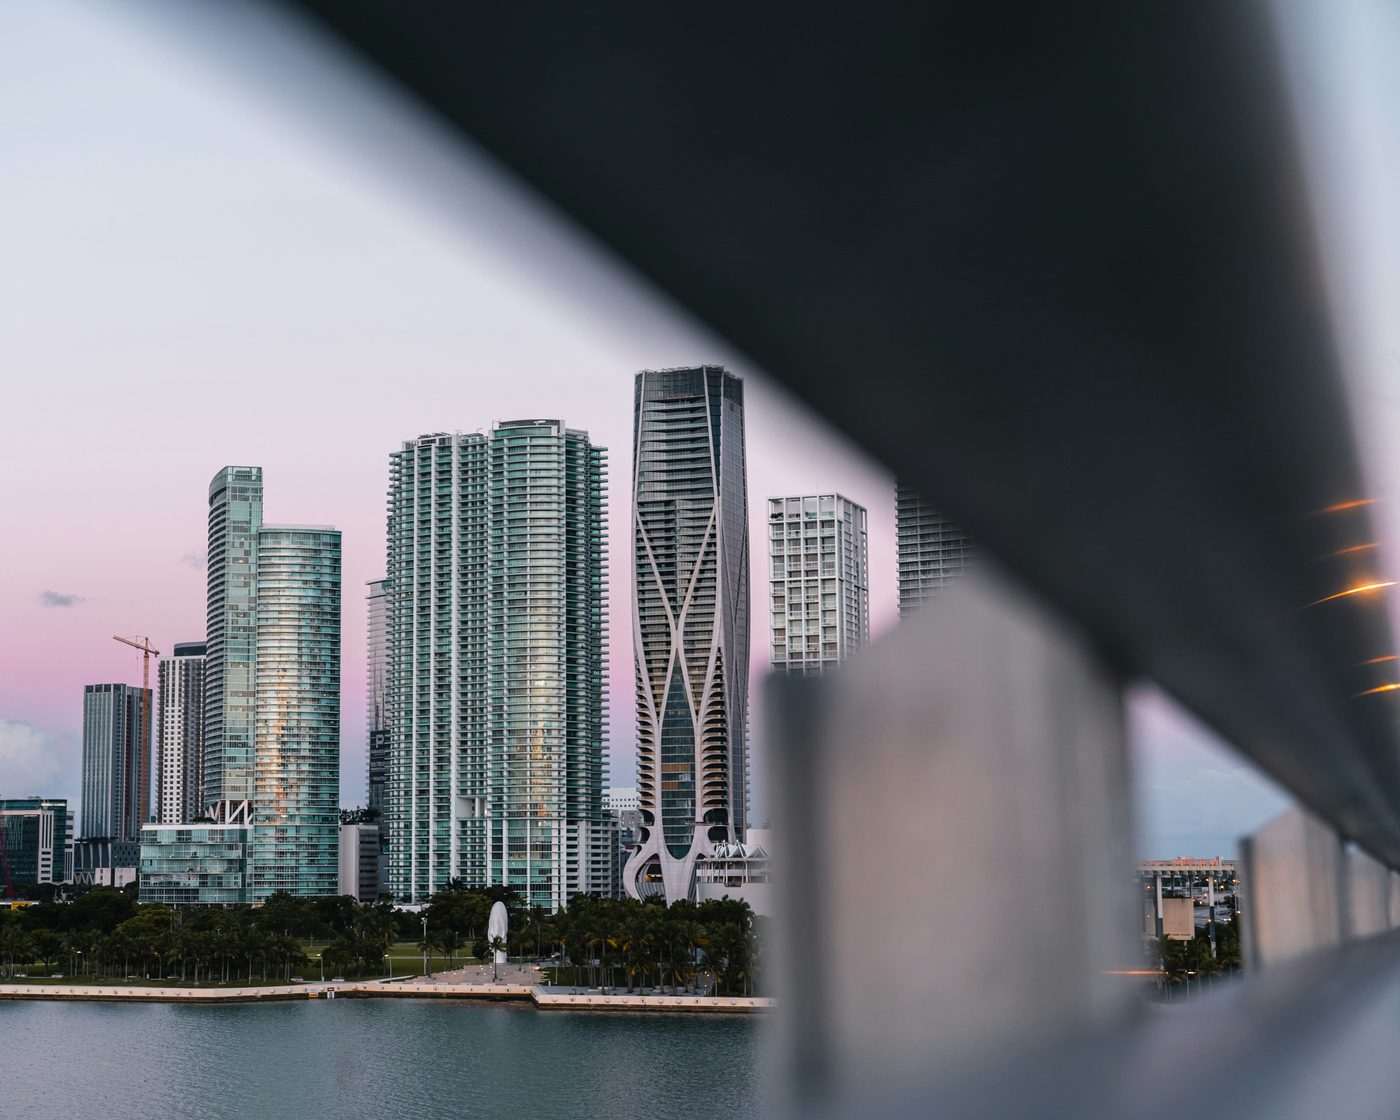
Brickell. Corporate, international, and dual-purpose travel. Vertical condo inventory. The financial-corridor anchor. Year-round occupancy curve with midweek strength.
Sunny Isles Beach. Oceanfront condo inventory anchoring South American and Russian-speaking demand. Long-stay weighting. Strong winter-season compression. International school calendars affect peak periods.
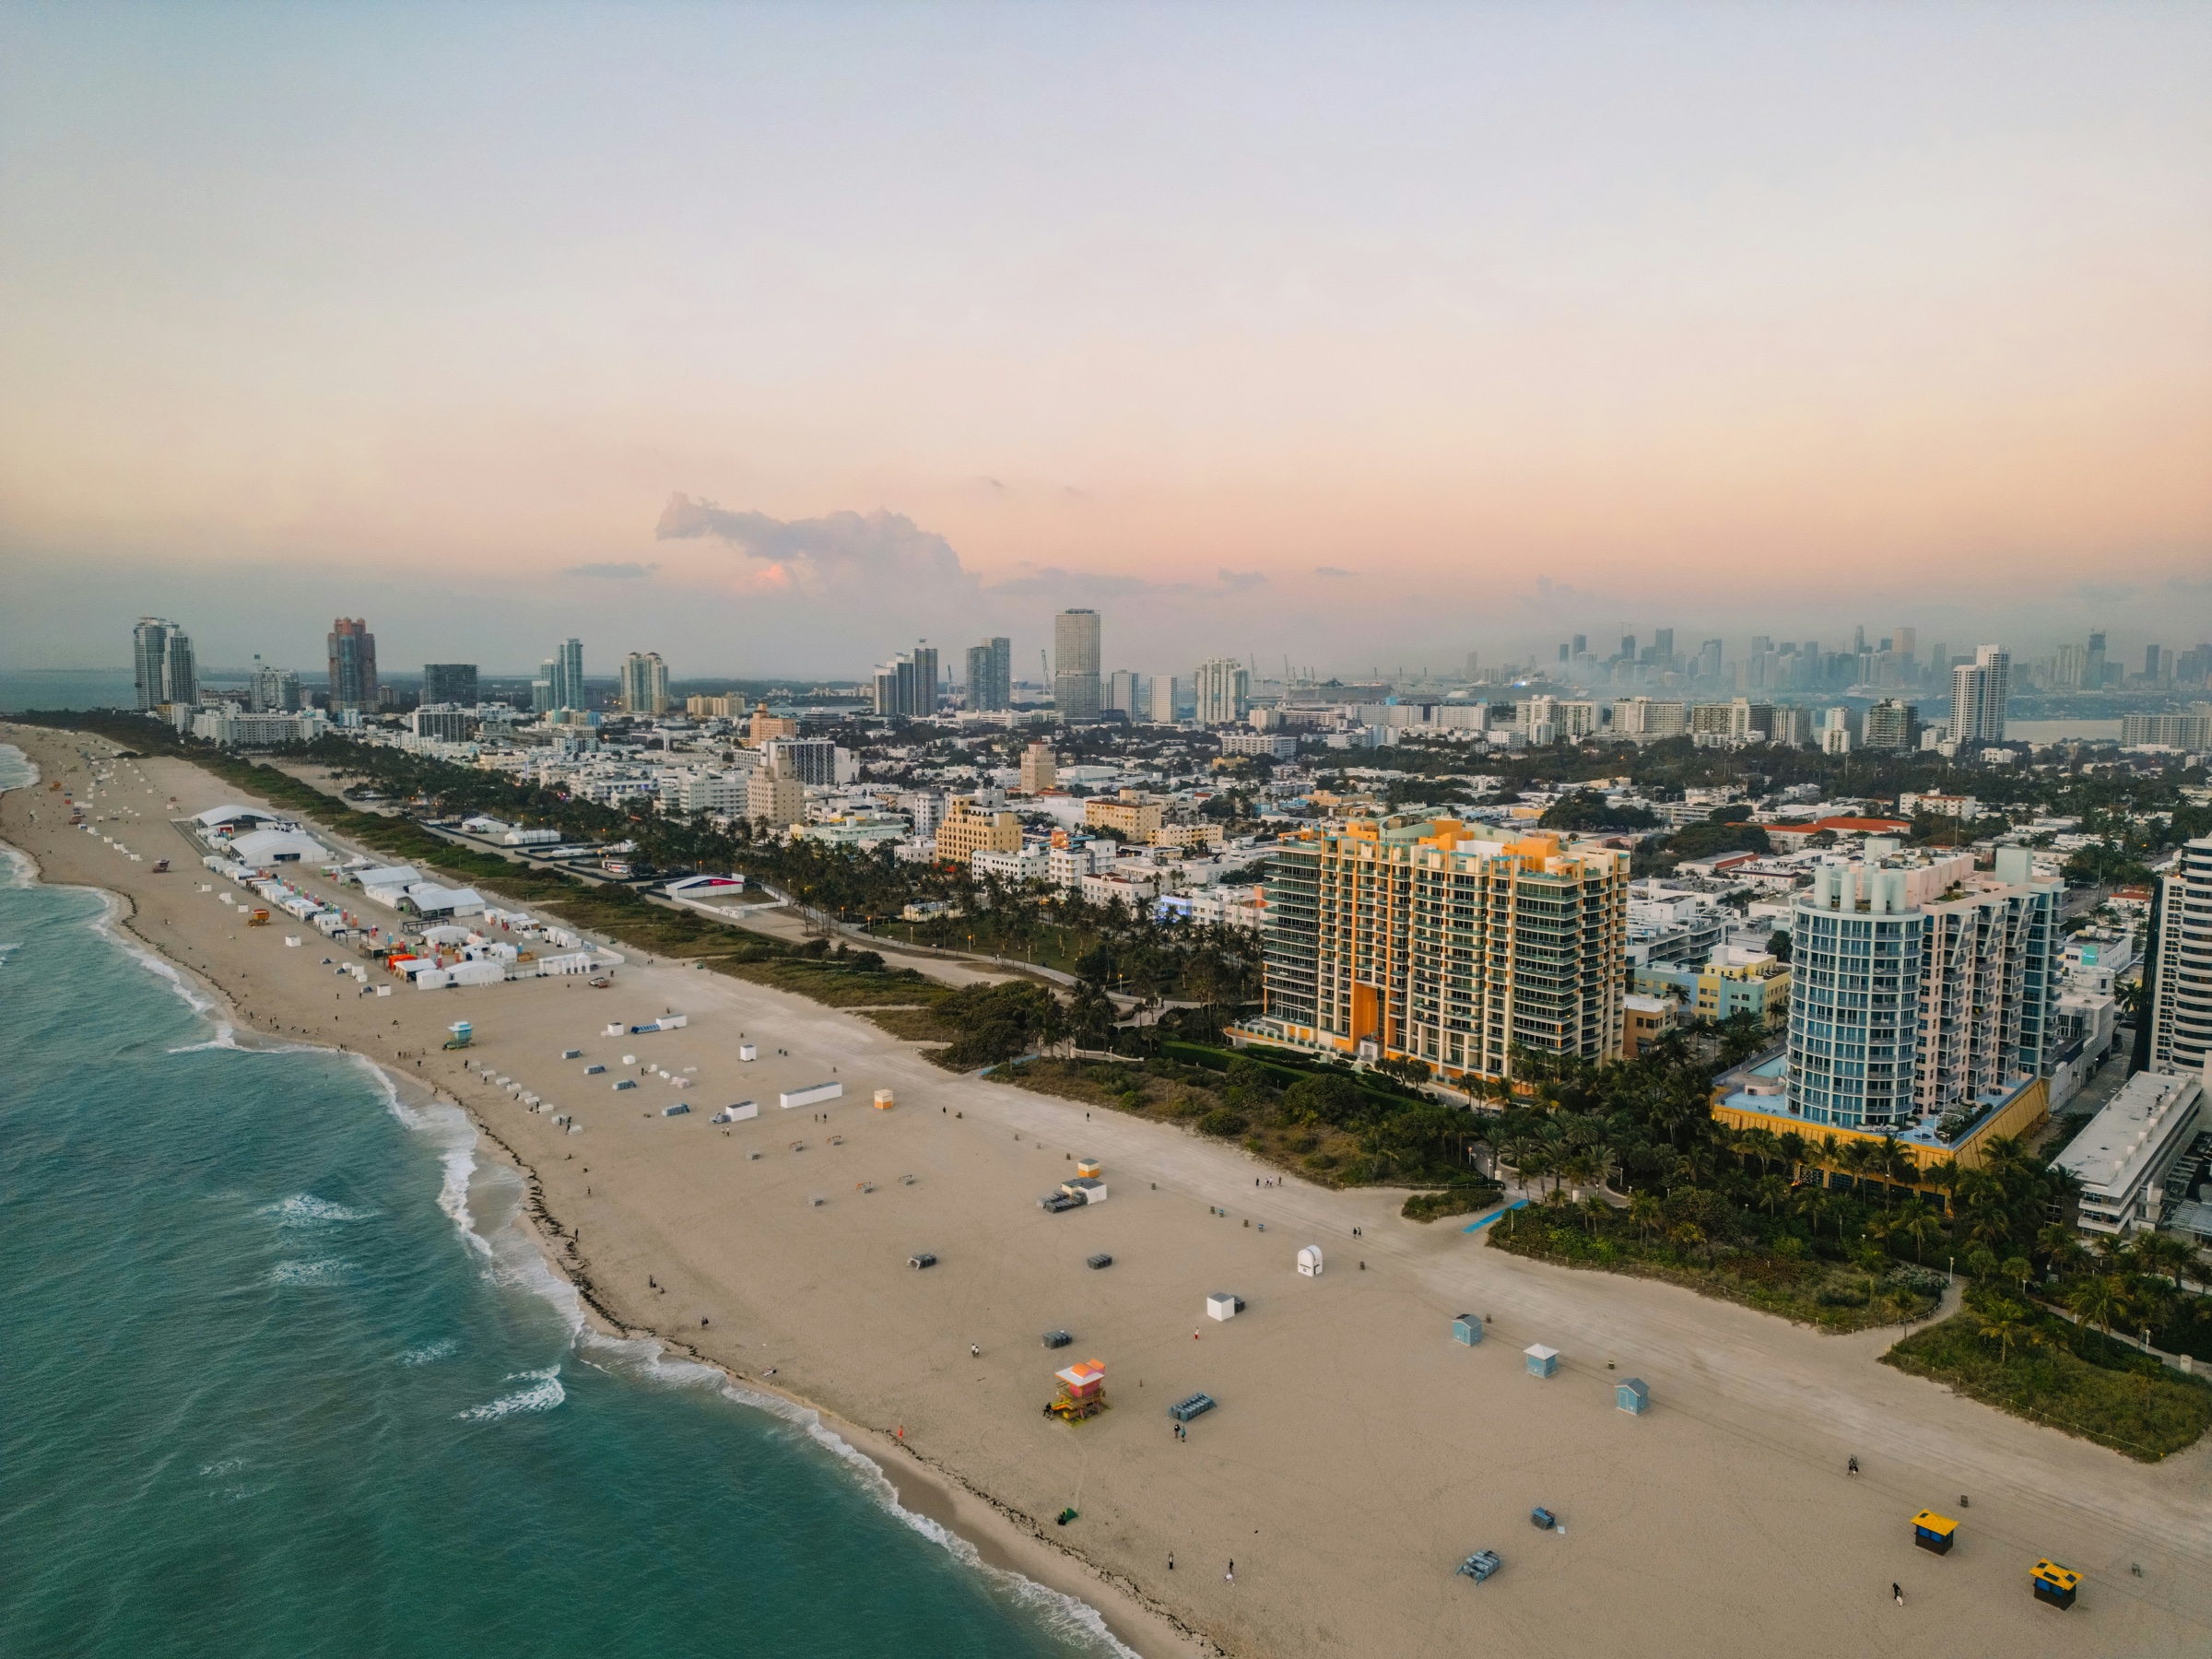
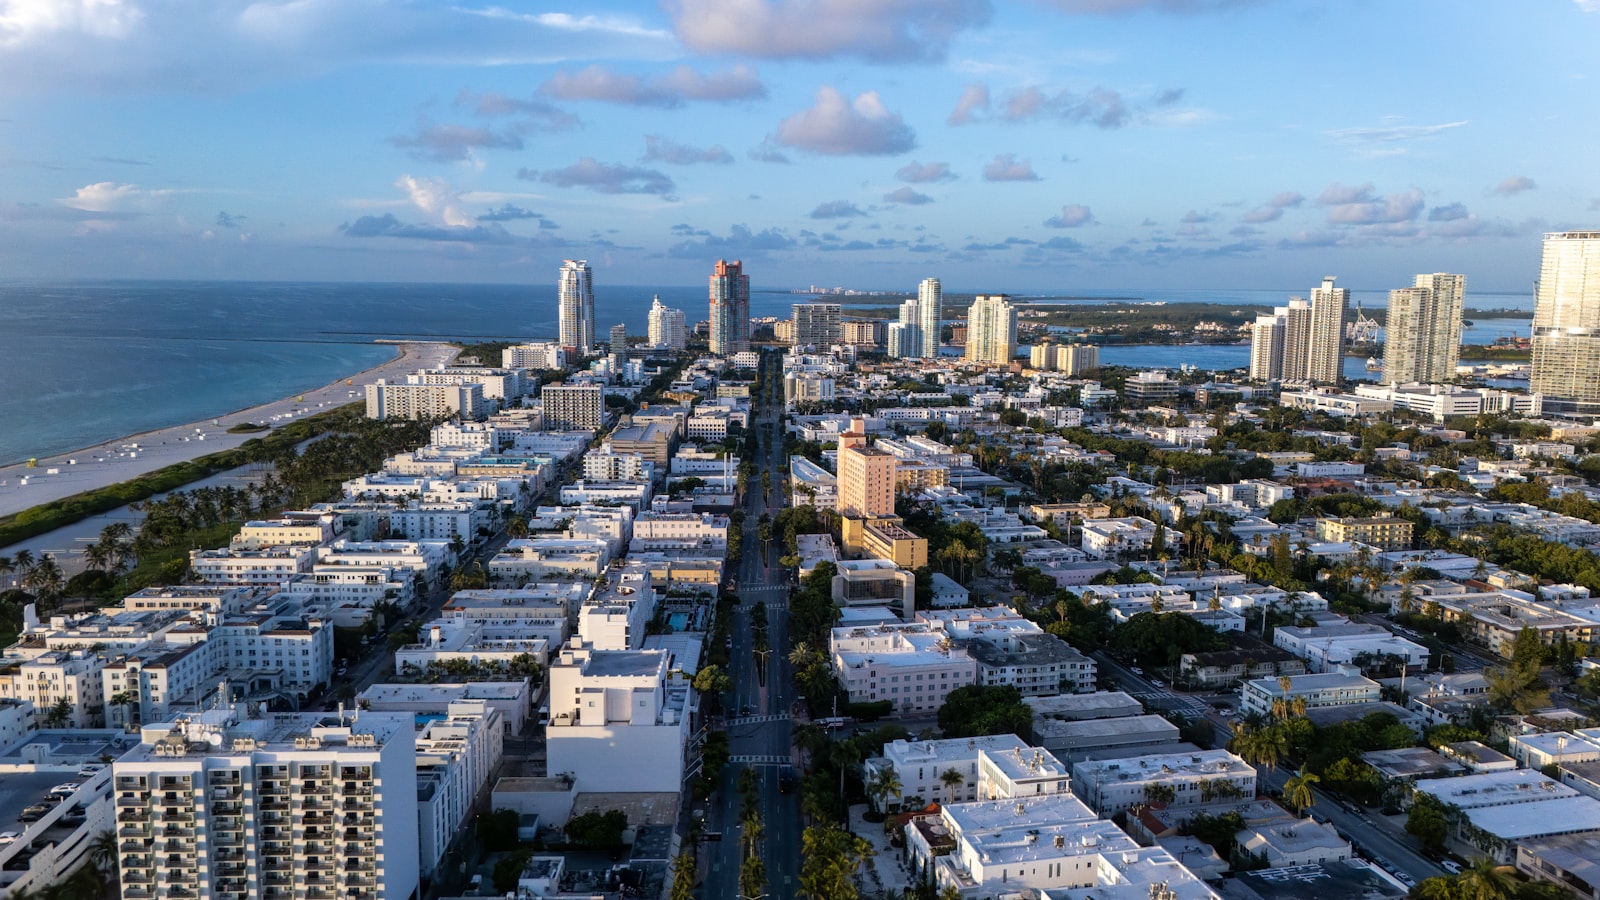
South Beach. Leisure, event, and nightlife demand. Pre-war hotel and condo inventory plus newer builds. The strongest event-driven submarket. Walkability supports stronger nightly rates than non-walkable inventory.
Edgewater. Newer-build inventory with Wynwood and Design District proximity. Younger guest mix. Fast-growing submarket with developer-quality units coming online continuously.
Coconut Grove. Family-trip and waterfront demand. Lower-density inventory. Longer average stays. Strong Boat Show compression.
The diversity matters because it makes the market resilient. When one submarket softens — for whatever reason — others typically do not soften with it. Operators running across multiple submarkets capture this distribution. Operators running concentrated inventory in one submarket take its volatility directly.
Why this is structural
The four engines — international flow, event compression, the financial-corridor migration, and submarket diversity — are not cyclical features. They are structural features of the city’s geography, demographics, and economic position.
International flow runs on relationships built over decades. The event calendar runs on infrastructure (the Convention Center, Hard Rock Stadium, Bayfront Park, the Boat Show grounds, the Miami Beach hotel district) that is built. The financial migration is a function of tax policy, talent supply, and lifestyle preference that has shown sustained directionality. Submarket diversity is geography that does not change.
For an owner, the implication is that Miami’s market position is not contingent on any single engine continuing to perform. Even with significant softness in one source market or one event, the overall demand profile remains.
For an operator, the implication is that Miami short-term rental management cannot be run on a generic playbook. The calendar, the international flows, the corporate corridor, and the submarket-specific demand patterns all need to be priced into the operating model — and the operating model has to be calibrated continuously, not annually.
The properties that out-perform are the ones whose operator runs to the calendar.